
-
Equipment
 Back
Back
Equipment
-
New Machines
Back
New Machines
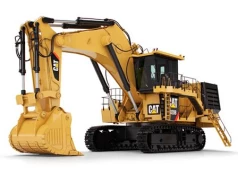 Hydraulic Mining Shovels
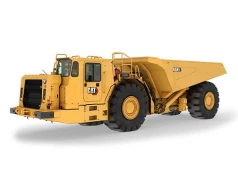 Underground - Hard Rock
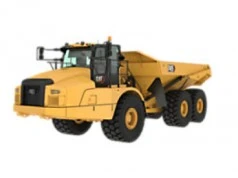 Articulated Trucks
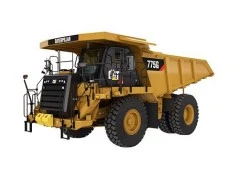 Off-Highway Trucks
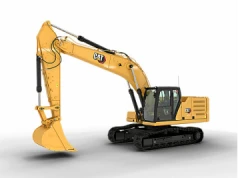 Excavators
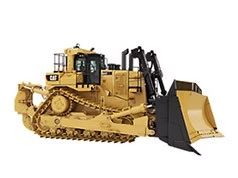 Dozers
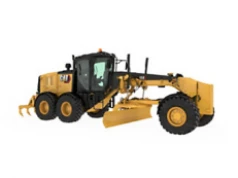 Motor Graders
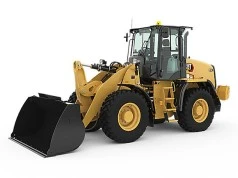 Wheel Loaders
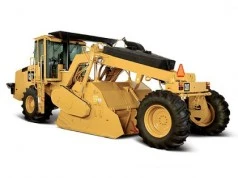 Road Reclaimers
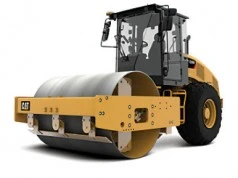 Compactors
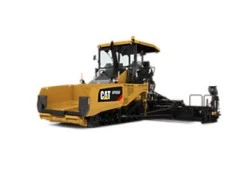 Asphalt Pavers
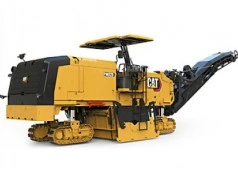 Cold Planers
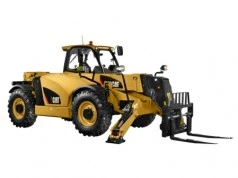 Telehandlers
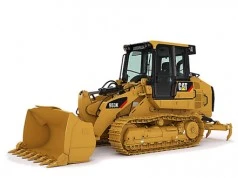 Track Loaders
 Pipelayers
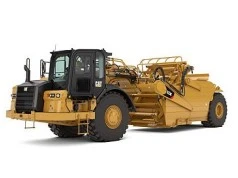 Wheel Tractor-Scrapers
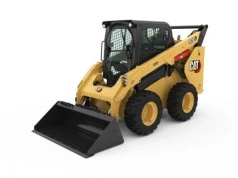 Skid Steer and Compact Track Loaders
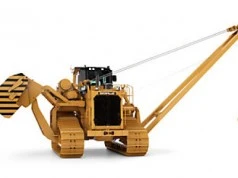
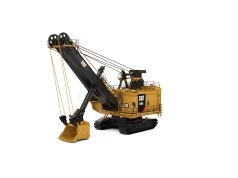 Electric Rope Shovels
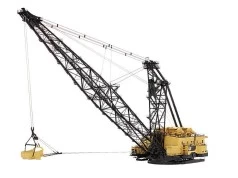 Draglines
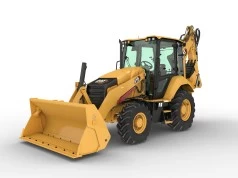 Backhoe Loaders
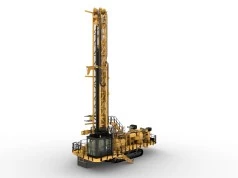 Drills
- Rental
- Used Equipment
- Engines
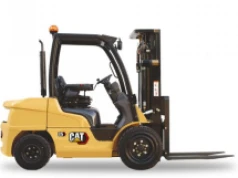
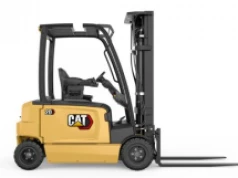
- CAT Lift Trucks
-
Work Tools
Back
Work Tools
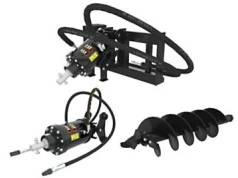 Augers
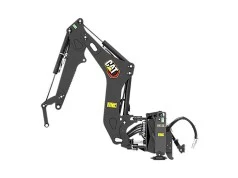 Backhoes
 Bale Grabs
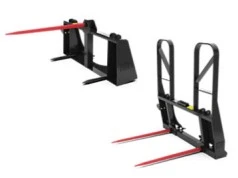 Bale Spears
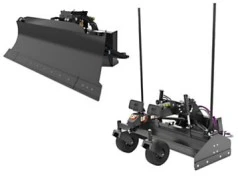 Blades
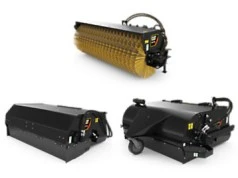 Brooms
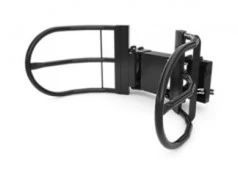
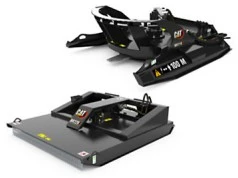 Brushcutters
 Buckets - Backhoe Front
 Buckets - Backhoe Rear
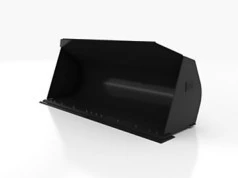
 Buckets - Compact Wheel Loader
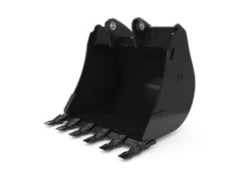
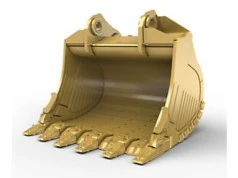
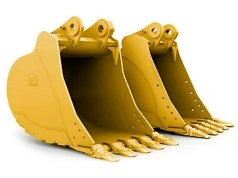 Buckets - Excavator
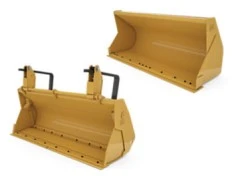
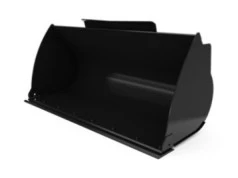
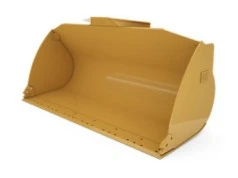 Buckets - Loader
 Buckets - Mining Shovels
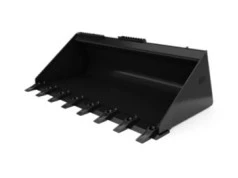 Buckets - Skid Steer Loader
 Buckets - Telehandler
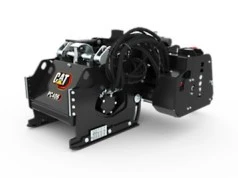 Cold Planers
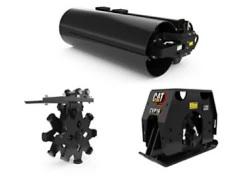 Compactors
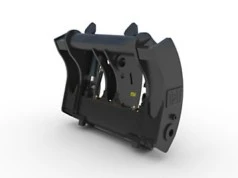 Couplers - Loader
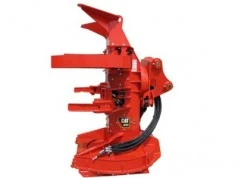 Felling Heads
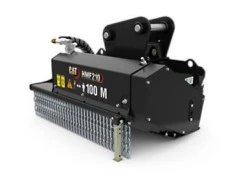 Flail Mowers
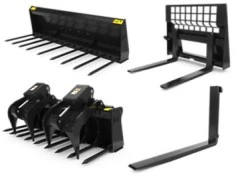 Forks
Forks
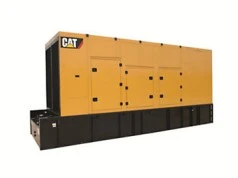 Electric Power: Genset Enclosures
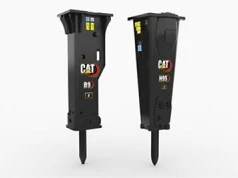 Hammers
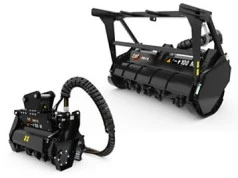 Mulchers
 Rakes
Rakes
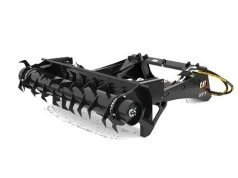
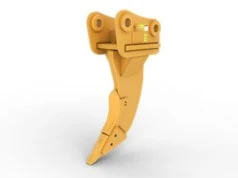 Rippers/Scarifiers
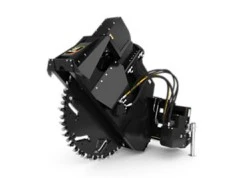 Saws
Saws
 Silage Defacers
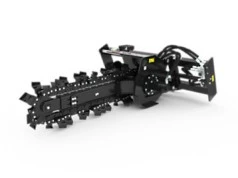 Trenchers
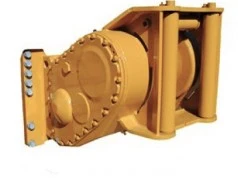 Winches
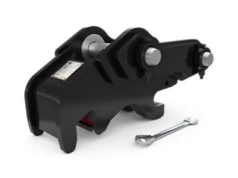 Couplers - Excavator
Couplers - Backhoe Rear
Couplers - Excavator
Couplers - Backhoe Rear
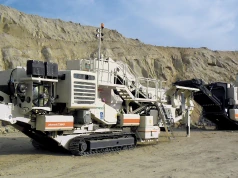
- Metso
-
New Machines
- Parts
- Service & Support
- Promotions
-
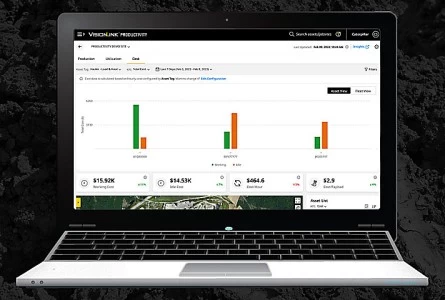
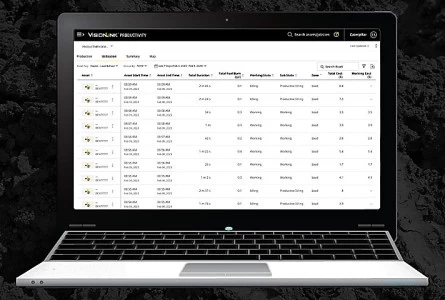
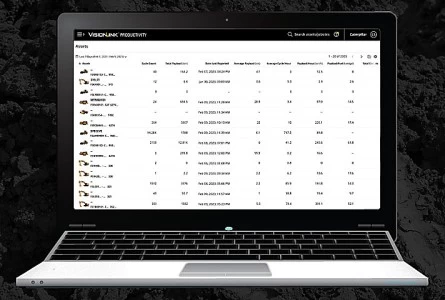
Technology
Back
Technology

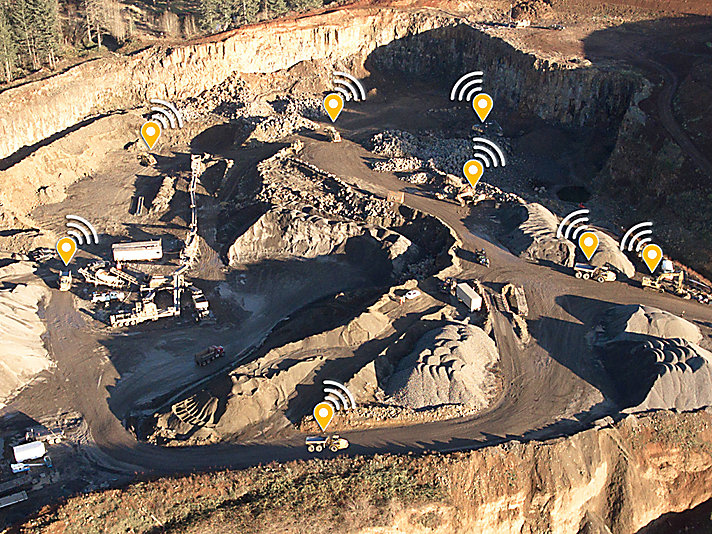
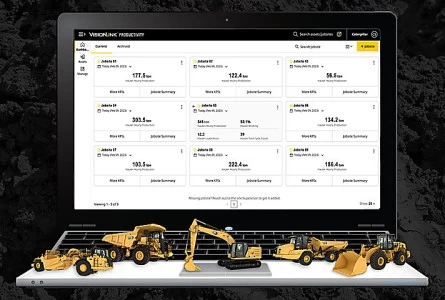
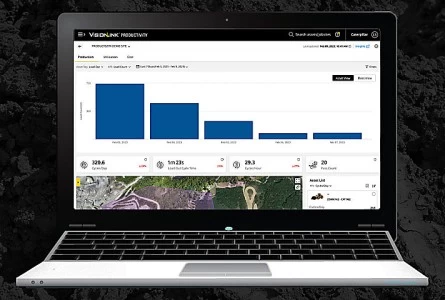
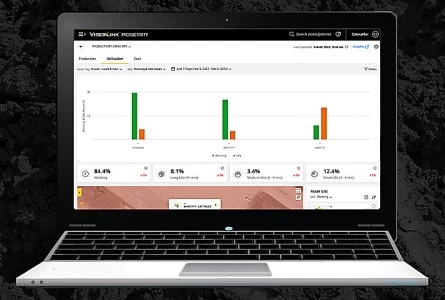
AN ONLINE HUB FOR YOUR EQUIPMENT INFORMATION, MANAGE YOUR EQUIPMENT YOUR WAY — WHENEVER, WHEREVER
-
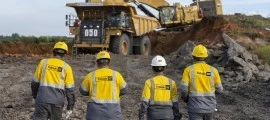
Industries
Back
Industries

Our experts can provide tailored solutions that will enable you to perform at your very best within your industry
View More - About Us
- Training

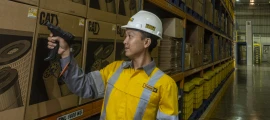

 BUY PARTS